
The ARC Awards are the longest running international annual report competition (30th anniversary this year!) I was honored to serve on the panel of ARC’s 60 worldwide judges for 2014 and 2015—which means spending quality time with several hundred of the thousands of excellent reports entered from all over the globe and many different industries. So, the ARC awards field of entries are a good proxy for the AR field in general.
Corporate annual reports occupy a unique role in 21st century communications. The financials are—at least for many organizations—reviewed by outside auditors, and must conform to legal and accounting rules. They also have the attention and usually participation of senior management. For these reasons, annual reports have a degree of credibility not accorded to advertising, social media, PR, or to any other form of corporate communication.
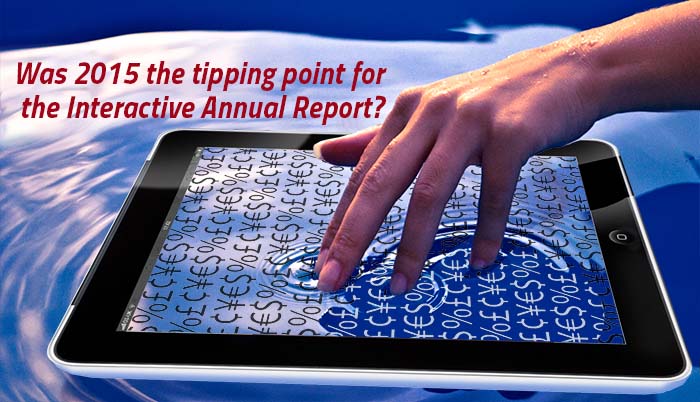
Technology is driving change: While the investment community has always been at the forefront of technology, investor relations professionals have necessarily proceeded in more cautious steps. ARC founder and president Reni Witt reports that printed annual reports are still the majority—interactive comprise only 12% of annuals submitted to ARC for FY 2015. But that’s up from 2% in FY 2011. And there is still a tremendous outpouring of creativity and production fireworks being lavished on printed annual reports. Perhaps more important than the numbers is the quality. The creative tools for interactive are different than print, but are finally getting sophisticated enough that interactive annual reports can be both expressive of the company and produced quickly enough for Investor Relations timetables. In 2015, annual reporting in interactive form have really started to come out of the shadows of their printed predecessors, and the potential impact for investor relations is seismic.
A new narrative form: Printed annual reports are essentially a linear narrative—the order of the presentation is controlled by the corporate writer. Interactive reports, with their video, animations, and hyperlinked objects are a more heuristic, reader-curated narrative. Some AR’s include a search function, which allows the serious analyst to drill down to their specific area of interest quickly. Catering to the analyst and serious investor is tremendously important. As the IR community gets more serious about in depth reporting and good navigation, the investing community will spend time with interactive reports, and the inflection point will be at hand. If we’re not there yet, we’re very close.
 How does this switch from linear narrative to hypermedia change the annual report’s credibility factor? What are the emerging trends and opportunities for a closer bond between the corporate management and stakeholders? Our August issue of InBrief Tipping Point for the Interactive Annual Report? discusses these issues, along with snapshots from and links to 4 interactive annual reports representing different approaches to Interactive Annual Reporting.
 David Laufer is Managing Partner of Atlanta-based BrandBook LLC, which specializes in branding, investor relations, and awards consultation. He currently serves as a design consultant to the government of Indonesia, as well as corporations and NGO’s in the US and UK. His multi-year engagement with PGN, the natural gas utility of Indonesia, has helped PGN’s Investor Relations team garner more than 40 awards. He writes for Design Intelligence and is the author of Dialogues with Creative Legends (Pearson, 2013).
LinkedIn: David Laufer
Twitter: @Dav1dLaufer
www.brandbook.us


